


Fado168.com offers flexible shipping packages
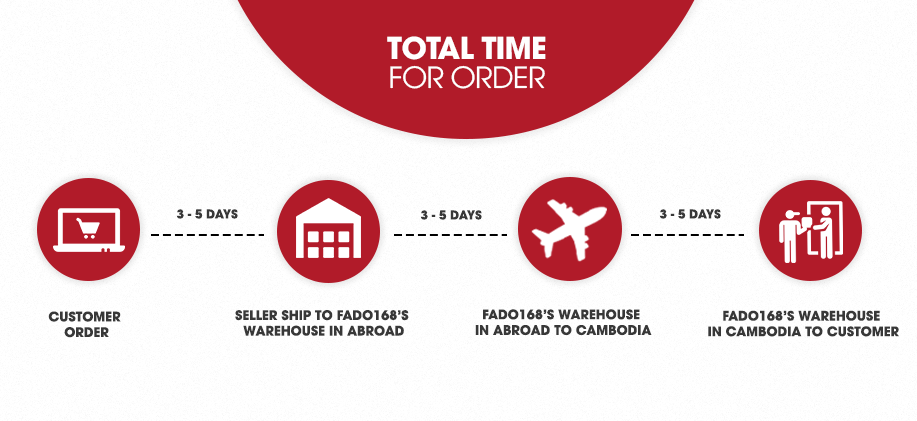
3-5 days 7-20 days
Support


 Contact


